- Raleigh’s trailing 12-month net absorption totals 2.0 million square feet (SF), above the historical average.
- The market has seen a near-record delivery of 3.8 million SF of new inventory in the past 12 months, outpacing demand.
- Vacancy rates in Raleigh have increased to 4.3%, still below the U.S. average of 4.9%.
- Raleigh has 6.3 million SF of new inventory under construction, representing a 6.3% expansion of existing inventory.
- New construction is concentrated in Raleigh’s southern and eastern parts, with good access to major interstates.
- Despite optimistic demand projections, only about 35% of the space under construction is preleased, suggesting a potential continued vacancy rise.
- Rental rates in Raleigh average $11.40/SF, slightly below the national average, with annual rent growth at 9.2%.
- The Raleigh market benefits from a diverse tenant base and has attracted significant expansions from major companies.
- Transaction volume in Raleigh was $626 million over the past 12 months, above the historical average, but slowed in the first half of 2023 due to rising interest rates.
- Recent transactions include the sale of a 39,500 SF warehouse in Southwest Wake County, indicating a plateauing of prices and rising capitalization (cap) rates.
Page Contents
- Rising Vacancy Amid High Supply
- Absorption vs. New Supply
- Market Dynamics and Future Outlook
- Demand and Supply Imbalance
- Tenant Activity and Market Movement
- Submarket Variations
- Raleigh’s Rent Context
- Industrial and Flex Rent Details
- Record Construction Activity
- Development Focus Areas
- Life Sciences and Pharmaceutical Growth
- Notable Industrial Developments
- Transaction Trends in Raleigh
- Market Pricing Dynamics
- Significant Recent Sales
- Impact of Major Acquisitions
- Closing Thougts
Rising Vacancy Amid High Supply
Raleigh’s industrial vacancy rate has increased in recent quarters. Supply growth has outpaced demand. This trend resulted in higher vacancies.
 Absorption vs. New Supply
Raleigh absorbed 2.0 million SF in a year, driven by e-commerce and life sciences. Yet, 3.8 million SF of new space was delivered, surpassing absorption.
Market Dynamics and Future Outlook
Raleigh’s vacancy rate once exceeded the national average. With 6.3 million SF under construction, vacancy rates may rise despite robust demand.
Demand and Supply Imbalance
Demand in southeastern Raleigh is strong. However, large-scale construction might continue to inflate the vacancy rate into 2024.
Tenant Activity and Market Movement
Notable leasing activity occurred across Raleigh, reflecting diverse industrial demand. This activity shows a dynamic market despite overall supply concerns.
Rent Growth TrendsAnnual rent growth in Raleigh stands at 9.2%. However, it’s been slowing down for three quarters. Certain areas still see rapid increases.
Submarket Variations
The fastest rent growth is in eastern Raleigh, like Southeast and Northeast Wake County. Overall, rent increases are becoming more moderate.
Raleigh’s Rent Context
Raleigh’s average rent is $11.40/SF, higher than some Southeastern markets. Life sciences spaces drive these premium rates.
Industrial and Flex Rent Details
In Raleigh, logistics rents average around $9.50 per square foot, with notable lease rates varying based on space size and lease term.
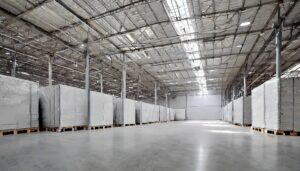
Record Construction Activity
Raleigh sees 6.3 million SF of industrial space under construction, a 6.3% market expansion. Preleasing stands at 35%.
Development Focus Areas
 Construction is booming in eastern and southern Raleigh—access to major interstates and supportive local policies fuel growth.
Life Sciences and Pharmaceutical Growth
Raleigh’s Research Triangle hosts expanding pharmaceutical firms. Fujifilm and Amgen are investing heavily in new facilities.
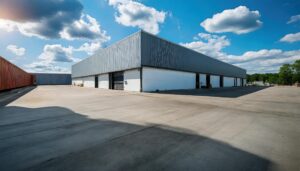
Notable Industrial Developments
Recent completions in Raleigh include significant properties like Apex Commercial Center, enhancing the industrial landscape.
Transaction Trends in Raleigh
Raleigh’s industrial sales hit $626 million, above the average. Yet, 2023 has seen a slowdown in transactions.
Market Pricing Dynamics
High competition for quality assets keeps Raleigh’s prices stable at $128/SF. Prices have leveled off after consistent growth.
Significant Recent Sales
Recent sales include a Southwest Wake County warehouse and Holly Springs Business Park, reflecting vigorous market activity.
Impact of Major Acquisitions
Prologis’ acquisition of Duke Realty significantly affected the Triangle market, highlighting Raleigh’s industrial real estate dynamics.
Closing Thougts
In conclusion, Raleigh’s industrial market is dynamic, marked by substantial absorption, construction, and shifting investment trends. The balance of demand and supply is key. Understanding these top 10 facts is crucial for strategic decision-making. For tailored investment guidance, contact Lumicre.